

Dashboard
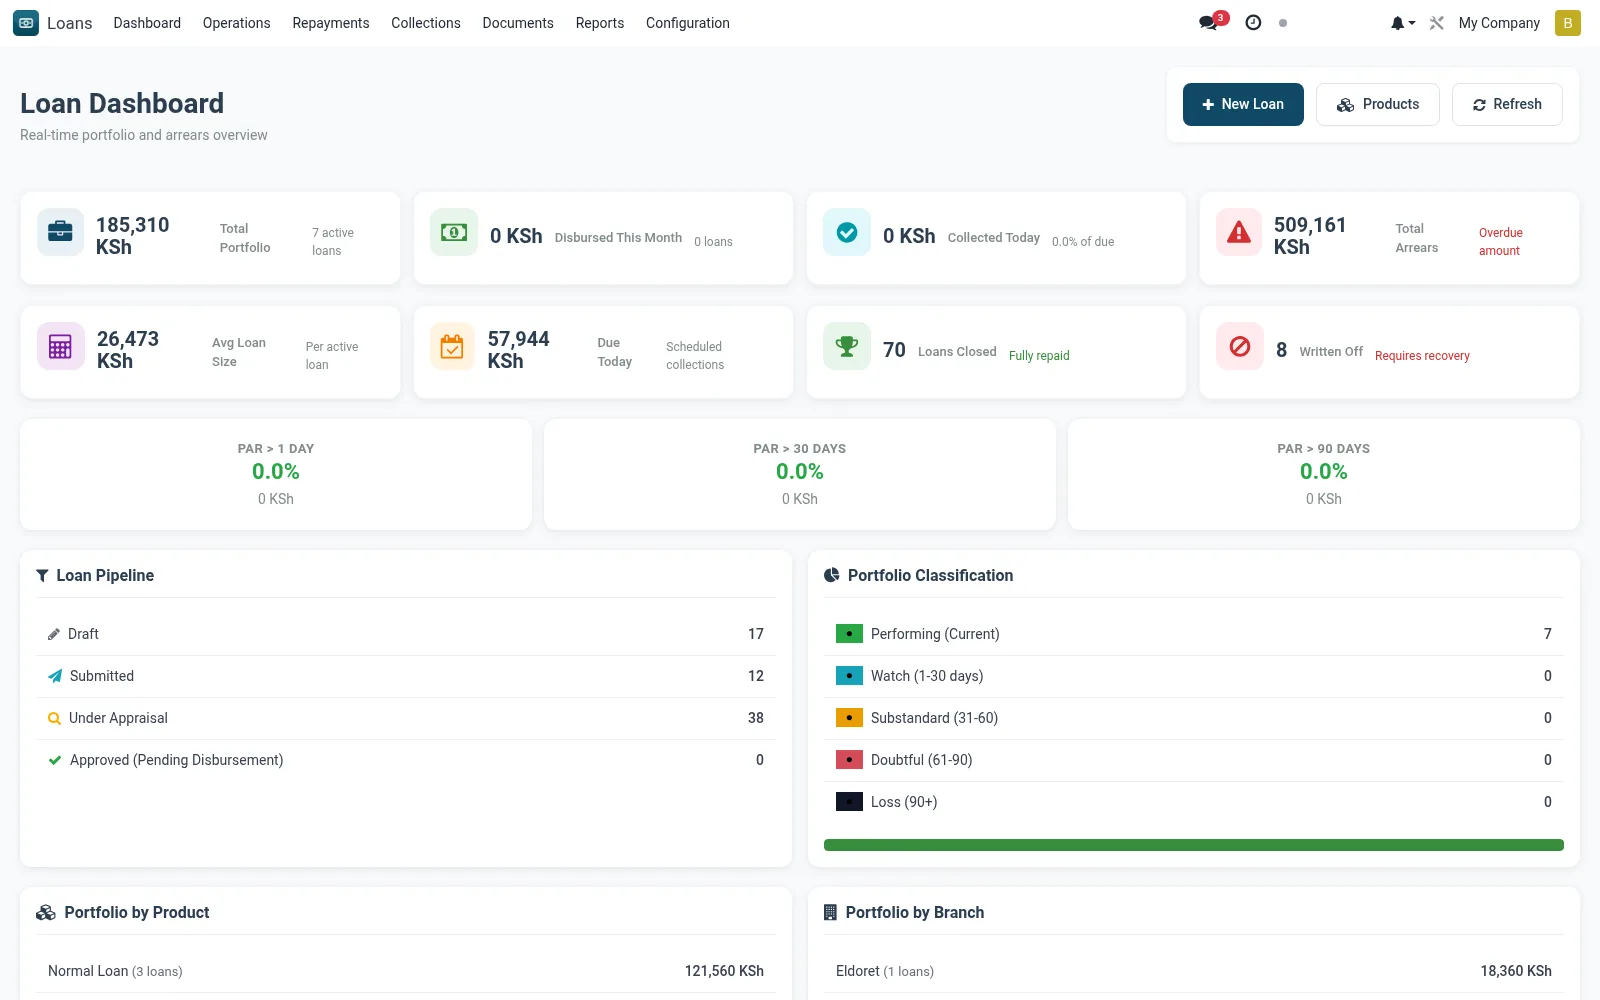
The Loans Dashboard is the portfolio command centre, surfacing live KPIs such as outstanding principal (OLB), Portfolio at Risk (PAR 30/60/90), disbursement and collection volumes, and active loan counts. Officers and managers use it to spot delinquency spikes and collection shortfalls at a glance before drilling into the underlying screens.
Workflow
- Open the dashboard to review headline KPIs for the current period.
- Check the PAR and arrears tiles for any breach of internal limits.
- Compare disbursed-versus-collected figures to gauge net portfolio growth.
- Click a tile or chart segment to drill through to the filtered loan or repayment list.
- Switch the period filter (day/month/quarter) to track trends over time.
Notes & rules
- KPIs: OLB, PAR 30/60/90, disbursed, collected, active loans, PAR ratio.
- Drill-through links to Active Loans, Repayments and Overdue screens.
- Read-only analytics view; no records are edited here.
Was this page helpful?