

Dashboard
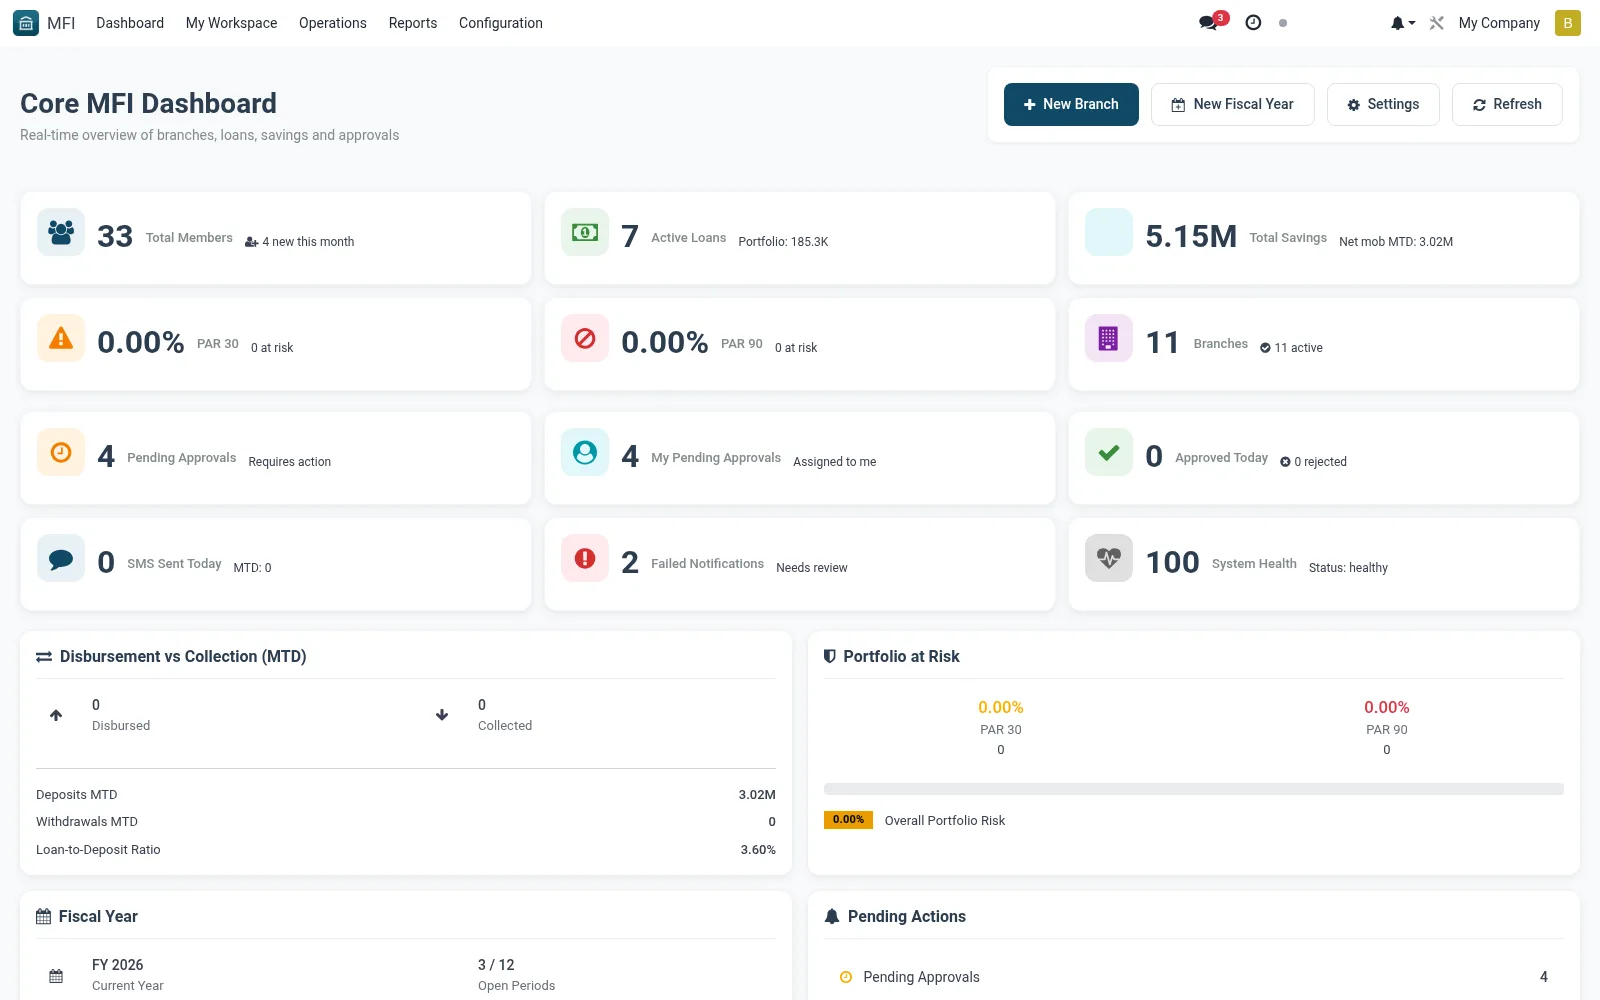
The executive dashboard is the institution's landing cockpit, surfacing live KPIs across savings, loans, members and treasury so leadership can read the health of the SACCO or microfinance book at a glance. Cards and charts roll up portfolio balances, PAR, deposit growth, disbursements and active-member counts. It is the first screen most managers open each morning to spot trends before drilling into detail.
Workflow
- Open MFI > Dashboard to load the consolidated KPI view
- Use the period and branch filters to scope figures to a region or financial year
- Click a KPI tile or chart segment to drill through to the underlying records
- Hover chart points to read exact values and period-over-period movement
- Pin or export a snapshot for board packs and management meetings
Notes & rules
- Aggregates data from savings, loans, treasury and member models
- Branch and date filters drive every widget
- Related: My Workspace queues, Branch Analysis report
- Used by executives, branch managers and operations leads
Was this page helpful?