

Macro scenarios — forward-looking overlay
IFRS 9 demands that ECL reflect 'reasonable and supportable' forward-looking information. The macro scenarios page is where that forward-looking lens is built — usually three scenarios (base, upside, downside), each with macro inputs and a probability weight, blended into a single ECL number.
Why macro scenarios exist
Historical default rates tell you what borrowers did in the conditions of the past. IFRS 9 wants ECL to reflect what borrowers will do in the conditions of the future. The bridge between the two is a macro model: a set of macroeconomic factors that explain default behaviour, projected forward under multiple scenarios, with each scenario probability-weighted.
We use three scenarios — a base case (most likely), an upside (better than expected), and a downside (worse than expected). Each scenario adjusts the through-the-cycle PD by a scalar derived from its macro factor projections. The final ECL is the probability-weighted ECL across the three scenarios.
The macro factors we use
Five Kenyan macroeconomic factors drive the PD overlay. They were selected from a longer list after back-testing against the internal default series. Each factor is sourced from a public release and refreshed before each quarter-end.
| Factor | Source | Update frequency | Relevance |
|---|---|---|---|
| Real GDP growth (y/y %) | KNBS Quarterly GDP release | Quarterly | Strong driver for business + SME segments |
| CPI inflation (y/y %) | KNBS Monthly CPI | Monthly | Consumer purchasing power, emergency loan stress |
| KES/USD exchange rate | CBK indicative | Daily | Import-cost shocks for trading SMEs |
| CBR (Central Bank Rate %) | CBK Monetary Policy | Bi-monthly | Funding cost + arrears correlation |
| Long-rains rainfall index | Kenya Met Office | Seasonal (Mar-Jun) | Agriculture segment driver |
How factors become a PD overlay
Each segment has a fitted linear overlay equation that maps macro factor deviations from baseline to a PD multiplier. The equations were fitted on 8 years of macro × default data using a least-squares regression.
The floor and cap prevent the overlay from producing unreasonable numbers when a factor moves outside the calibration range. They are documented in the model documentation and the cap has been hit twice in the last three years (Covid-19 H1 2020 and the 2022 FX shock).
# Example — Business SME segment overlay
# Calibrated coefficients (stored on ifrs9.segment.overlay)
#   beta_gdp = -0.45     (1pp lower GDP → +45% PD)
#   beta_cpi = +0.12     (1pp higher CPI → +12% PD)
#   beta_fx  = +0.08     (KES/USD +1% → +8% PD)
#   beta_cbr = +0.18     (CBR +1pp → +18% PD)

def pd_multiplier(segment, scenario):
    s = scenario.macro_factors  # dict of projected values
    delta_gdp = s['gdp'] - segment.baseline_gdp
    delta_cpi = s['cpi'] - segment.baseline_cpi
    delta_fx  = (s['fx']  / segment.baseline_fx)  - 1.0
    delta_cbr = s['cbr'] - segment.baseline_cbr
    raw = 1.0 \
        + segment.beta_gdp * delta_gdp \
        + segment.beta_cpi * delta_cpi \
        + segment.beta_fx  * delta_fx \
        + segment.beta_cbr * delta_cbr
    return max(0.4, min(raw, 2.5))  # floor 0.4×, cap 2.5×
Scenario weights
After each scenario produces its own ECL, the three are blended:
Default weights are 50% base / 25% upside / 25% downside. The Risk Committee can shift weights when forward-looking conditions justify it — most commonly raising the downside weight in periods of macroeconomic stress.
ecl_weighted = w_base * ecl_base + w_upside * ecl_upside + w_downside * ecl_downside
# w_base + w_upside + w_downside == 1.0Projection horizon
Macro factors are projected over a horizon that covers the longest expected lifetime in the loan book — typically 5 years. Years 1-2 are the 'reasonable and supportable forecast' period (from named institutional forecasts). Years 3-5 revert linearly to the long-term mean.
| Year | Source | Method |
|---|---|---|
| 1-2 | IMF WEO + CBK / Treasury BPS forecast | Direct institutional projection |
| 3 | Linear blend | 75% institutional / 25% long-term mean |
| 4 | Linear blend | 50% / 50% |
| 5+ | Long-term mean | Through-the-cycle baseline |
What you see on the screen
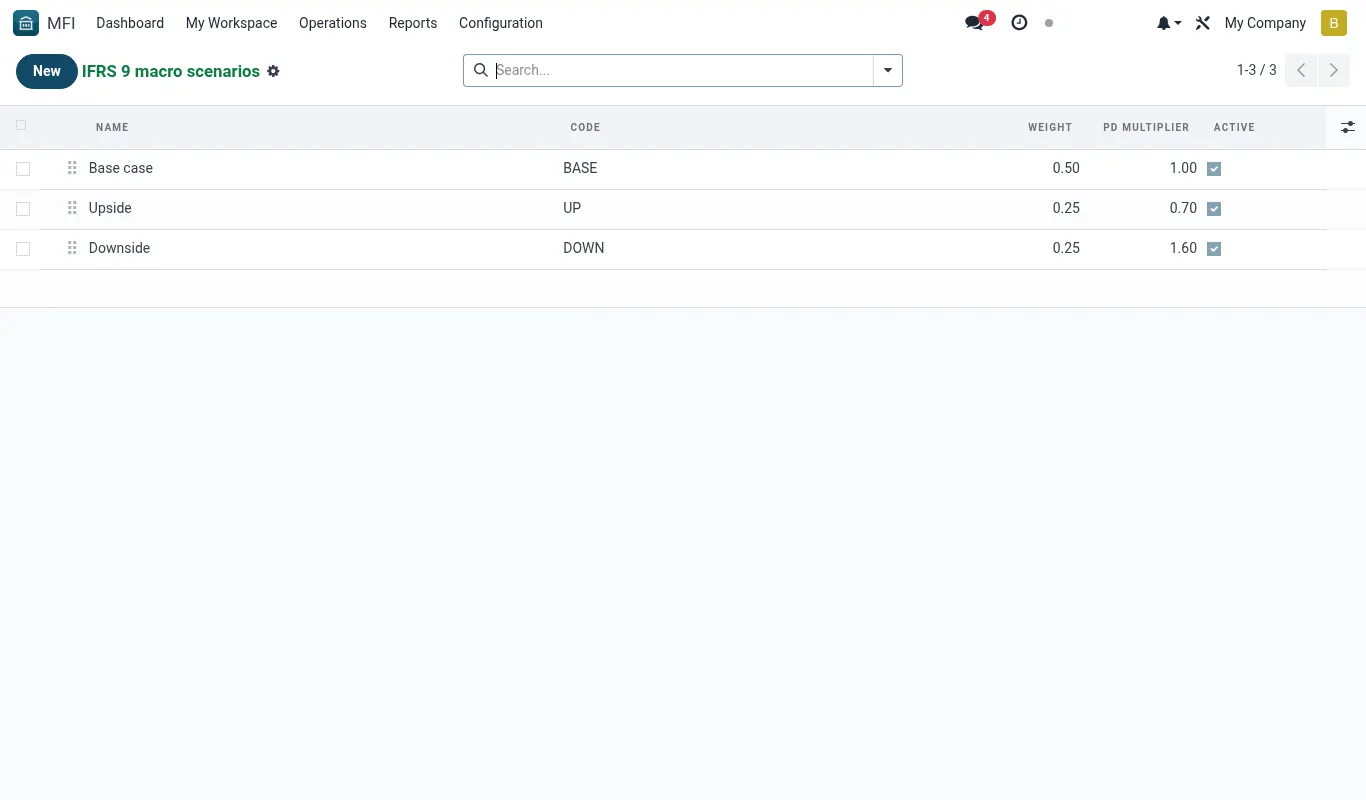
IFRS 9 → Configuration → Scenarios lists the current scenario set. The screenshot shows base / upside / downside with their respective weights, macro factor inputs, and a 'last approved' stamp. Editing requires Risk Manager privileges; posting requires CFO sign-off.
Worked scenarios
Scenario — Pandemic-style downside shock — Risk Committee raises downside weight
| Character | Role |
|---|---|
| Kimani Mwangi | Risk Manager |
| Florence Achieng | CFO |
| Peter Otieno | Board Risk Committee Chair |
| Mary Mutua | Head of Credit |
Timeline
- Mar 18: Risk Committee meets ad-hoc. Reviews global infection trajectory and 2020 default playbook. (Minute item 1)
- Mar 18: Committee decides: downside weight 25% → 40%, base 50% → 45%, upside 25% → 15%. Downside scenario macro factors adjusted: GDP -3pp, CPI +2pp, KES/USD +8%. (Minute item 2)
- Mar 19, 10:00: Kimani opens IFRS 9 → Scenarios. Edits the downside scenario in draft. Updates the three macro factors and saves. (ifrs9.scenario state=draft)
- Mar 19, 11:30: Kimani edits the weights. System refuses — weights must sum to 100%. Re-checks: 45+15+40 = 100. Saves. (Validation OK)
- Mar 19, 14:00: Kimani attaches the minute extract as supporting evidence. (ir.attachment linked)
- Mar 20, 09:00: Florence reviews and approves. CFO sign-off captured. (ifrs9.scenario state=approved, effective Mar 31)
- Mar 31, 23:59: Quarter-end snapshot. Q1 run starts. (ifrs9.run state=snapshotted)
- Apr 2: ECL computed. Base scenario ECL: KES 9.1M. Downside scenario ECL: KES 24.6M. Weighted: KES 14.2M (vs Q4 KES 9.8M). (state=computed)
- Apr 4: Florence walks board through the ECL bridge: +KES 3.4M from downside weight change, +KES 1.0M from macro factor stress. (Audit pack section 4)
Outcome — Forward-looking provision built ahead of the actual default deterioration; board comfortable; auditor satisfied with the documentation trail.
Reference
ifrs9.scenario fields
| Field | Type | Notes |
|---|---|---|
| name | Char | e.g. 'Base — Q4 2026' |
| scenario_type | Selection | base | upside | downside | custom |
| weight | Float | Probability weight 0.0 – 1.0 |
| effective_from | Date | First run this applies to |
| effective_to | Date | Last run this applies to |
| macro_factors_json | Text(JSON) | Year-by-year projections of each factor |
| approved_by | Many2one(res.users) | CFO required |
| approval_evidence_ids | One2many(ir.attachment) | Minutes, MoUs, reports |
Default shipped scenario set
| Scenario | Weight | GDP y1 | CPI y1 | KES/USD | CBR |
|---|---|---|---|---|---|
| Base | 50% | 5.0% | 6.5% | 130 | 10.50% |
| Upside | 25% | 6.2% | 5.0% | 125 | 9.50% |
| Downside | 25% | 2.8% | 9.0% | 142 | 12.50% |
Troubleshooting
| Symptom | Likely cause | Fix |
|---|---|---|
| Cannot save scenario — error 'weights must sum to 1.0'. | Decimal rounding (e.g. three rows of 0.333 = 0.999). | Adjust one weight to absorb the rounding (e.g. base 0.34, upside 0.33, downside 0.33). Better: use weights that sum exactly (0.5 / 0.25 / 0.25). |
| All three scenarios produce identical ECL. | Macro factor projections are identical across scenarios, usually because someone copied the base without editing. | Open the upside and downside scenarios and ensure macro_factors_json differs from base. The validator should warn — check that the warning was not dismissed. |
| PD overlay multiplier is hitting the cap (2.5×) on most segments. | Downside scenario macro factors set unreasonably extreme. | Sense-check downside: should be a plausible bad case, not Armageddon. The cap is a safety net, not a target. Refer to peer benchmarks or historical 2008/2020 reference set. |
| Auditor asks 'why was the upside weight 25% in a clearly improving environment?' | Weights have not been refreshed during a multi-quarter expansion. | Take a weight-review proposal to Risk Committee. Document the rationale for keeping vs changing. Symmetry isn't required — weights should reflect the genuine distribution of forward outcomes. |
| Macro factor source unavailable (e.g. KNBS release delayed). | External release missed deadline. | Use the most recent available release and document the data lag in the audit pack. Do not delay the run — IFRS 9 explicitly allows reasonable approximation when current data is unavailable. |