

Four boards, and every figure on them opens its own records
Overview
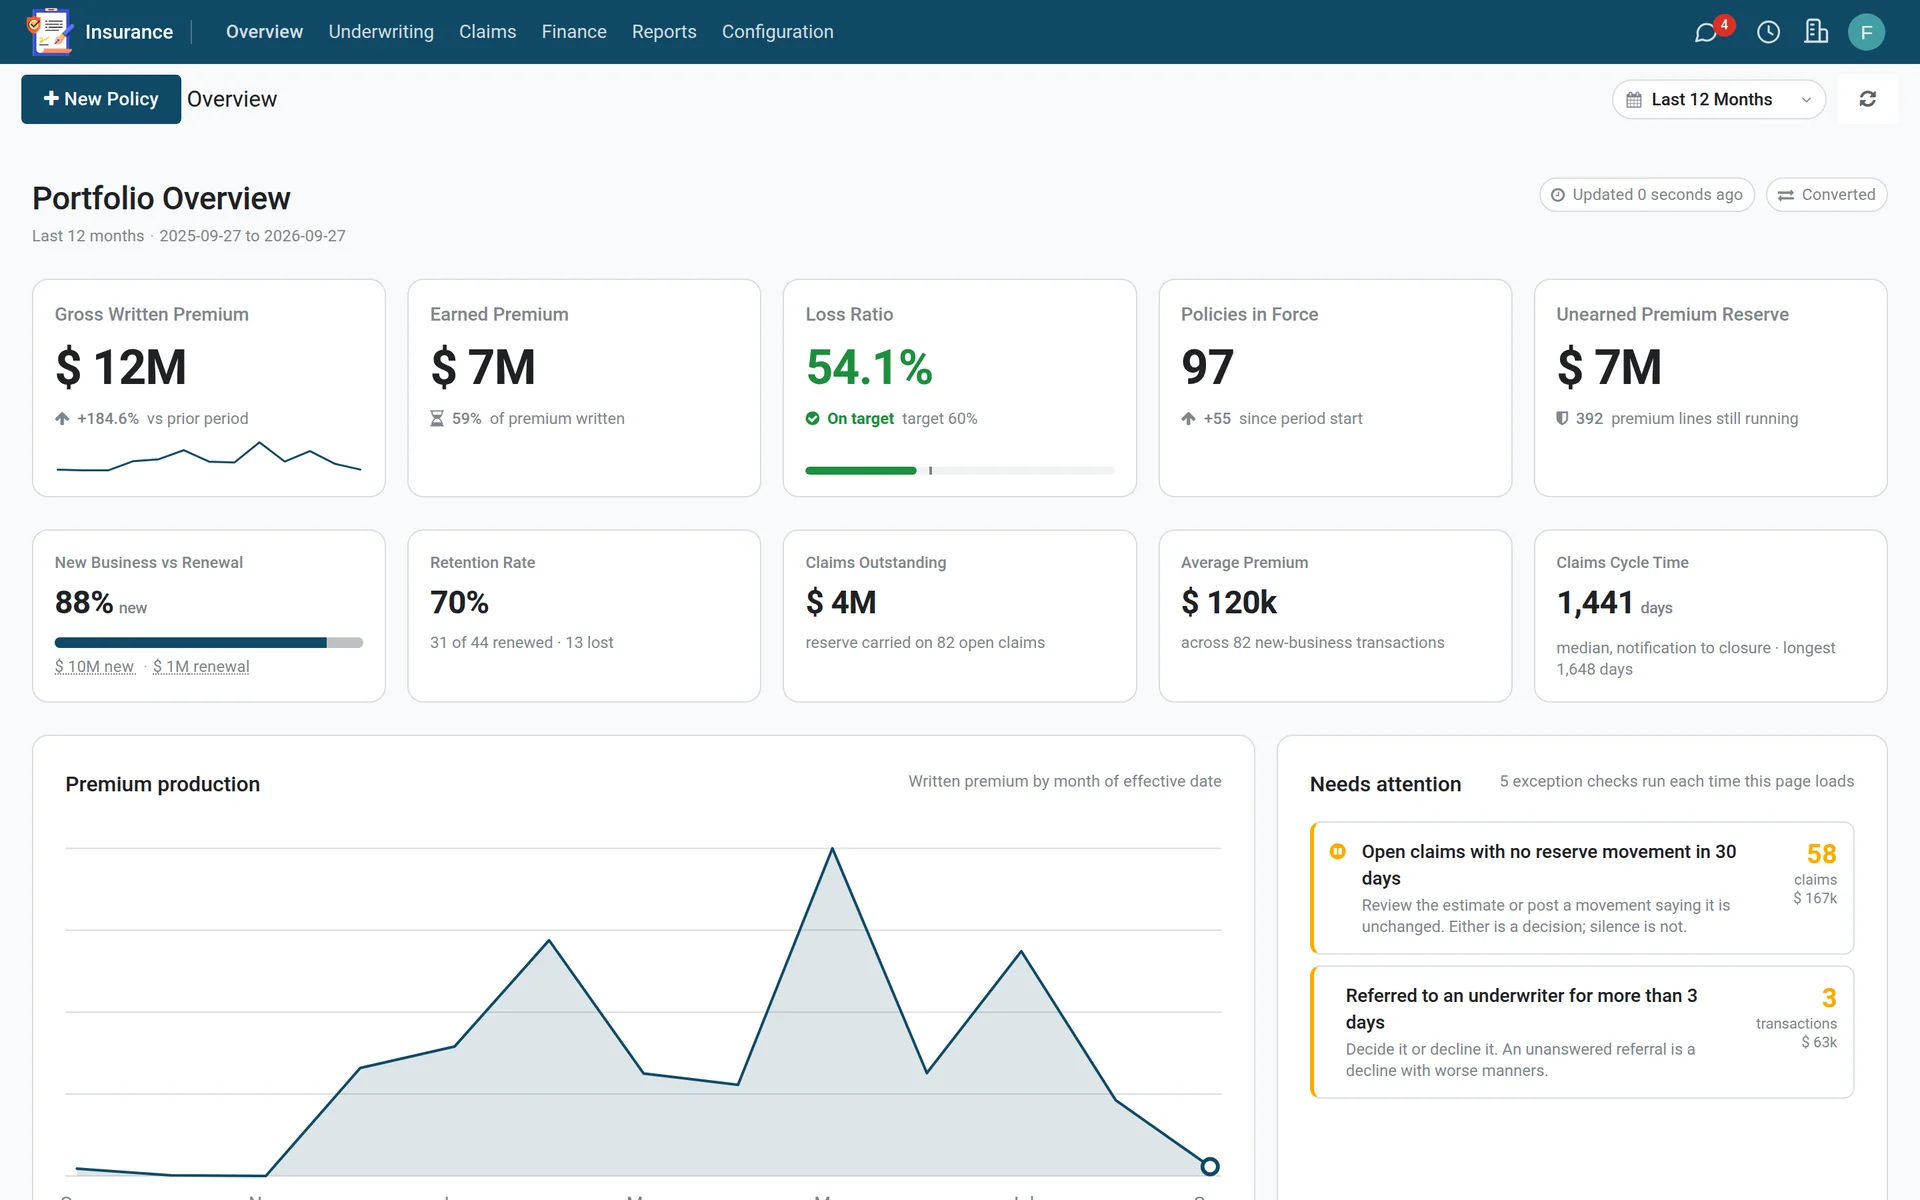
The screen the desk leaves open. Gross written and earned premium, the loss ratio against its target, policies in force, the unearned reserve still to run off, renewals falling due and the claims waiting on somebody — each computed from the policy, premium and claim records underneath, never from a figure somebody keys in each month.
Runoff, renewals and the largest open claims
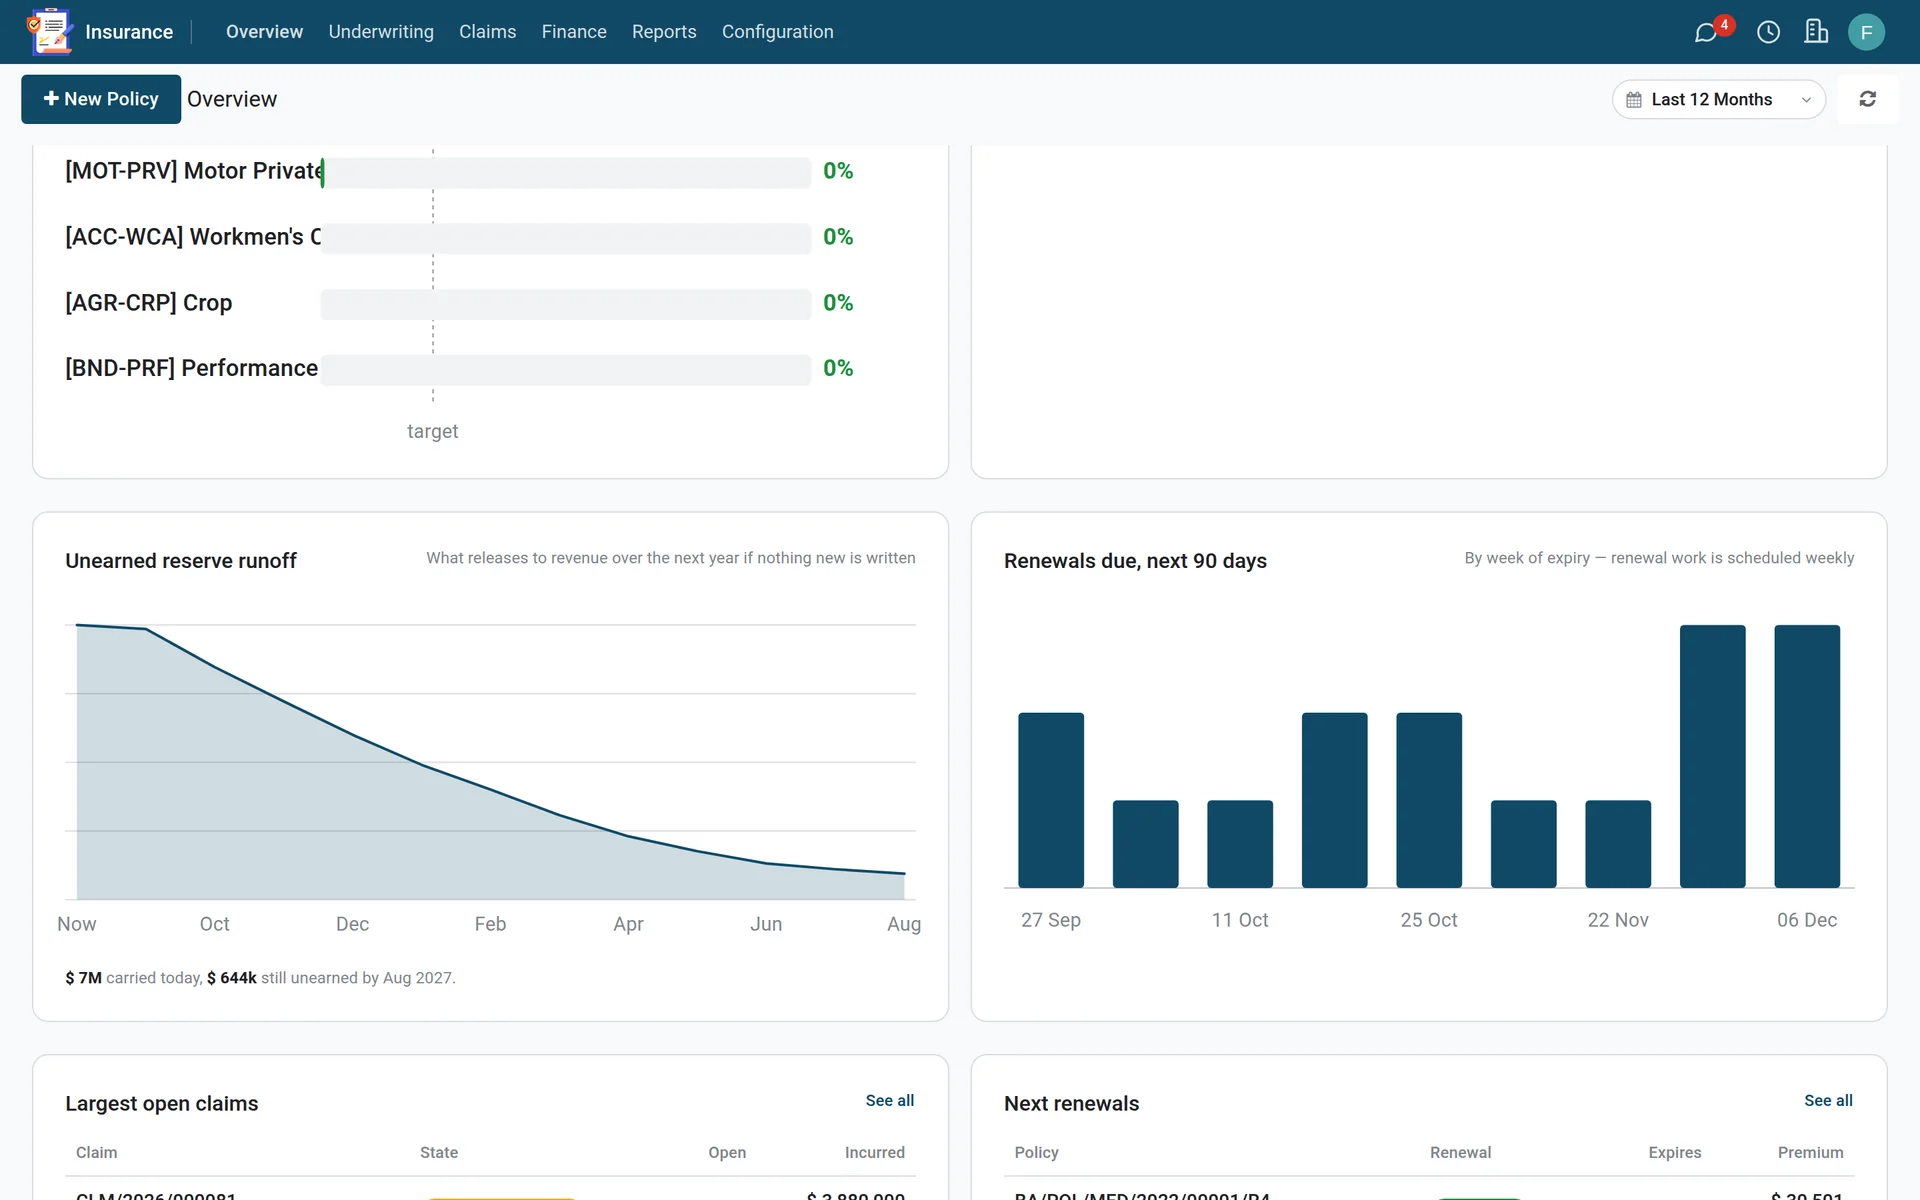
What releases to revenue over the next year if nothing new is written, the renewals due in the next ninety days by week, and the open claims and renewals that need a decision.
Today, yesterday, this week - on every list
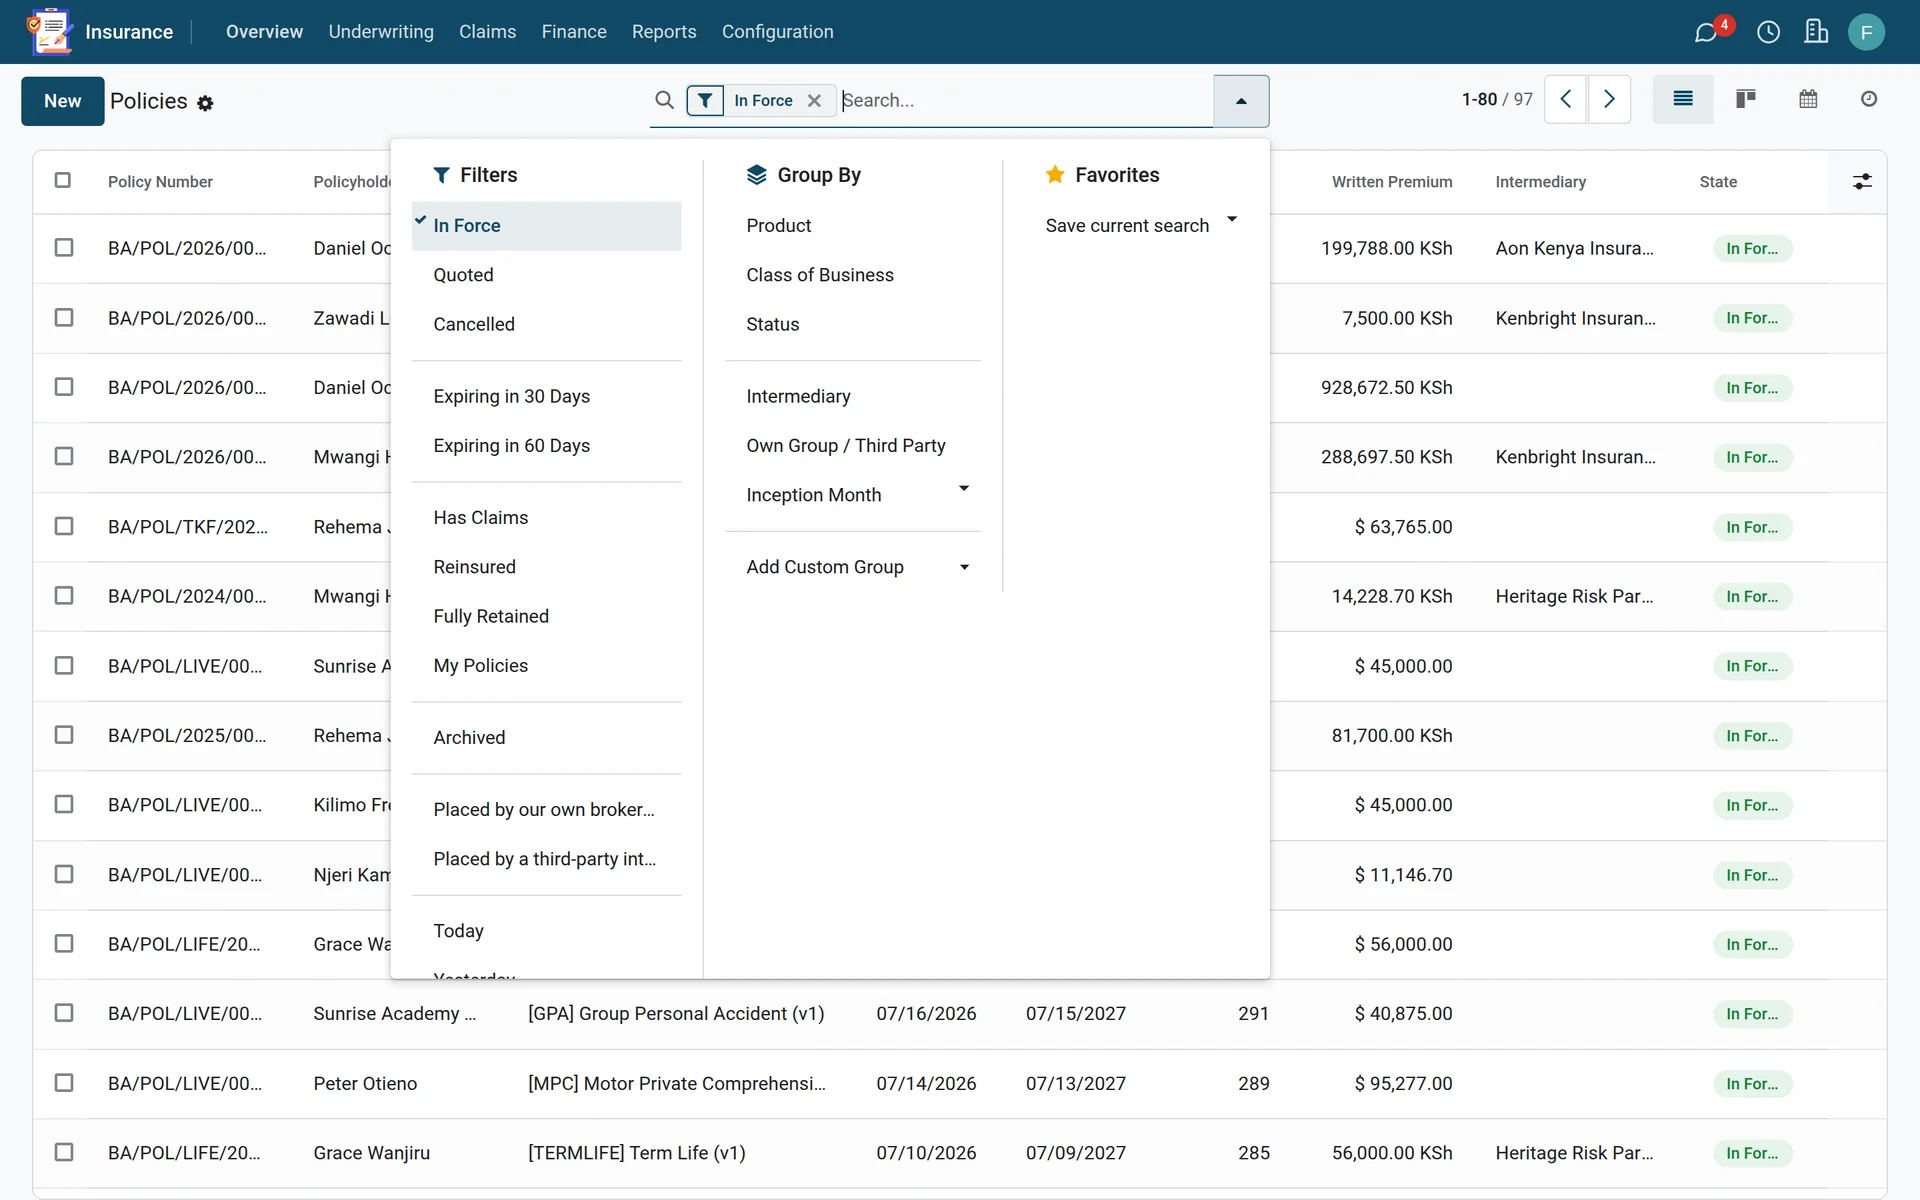
Thirty-eight lists carry the same eight windows, each on the one date that screen is actually reported by - a submission by when it was received, a claim by its loss date, an instalment by when it falls due. Portfolio Overview takes eleven of them, and every window is compared against the window of the same length immediately before it.
Production, pivoted by class
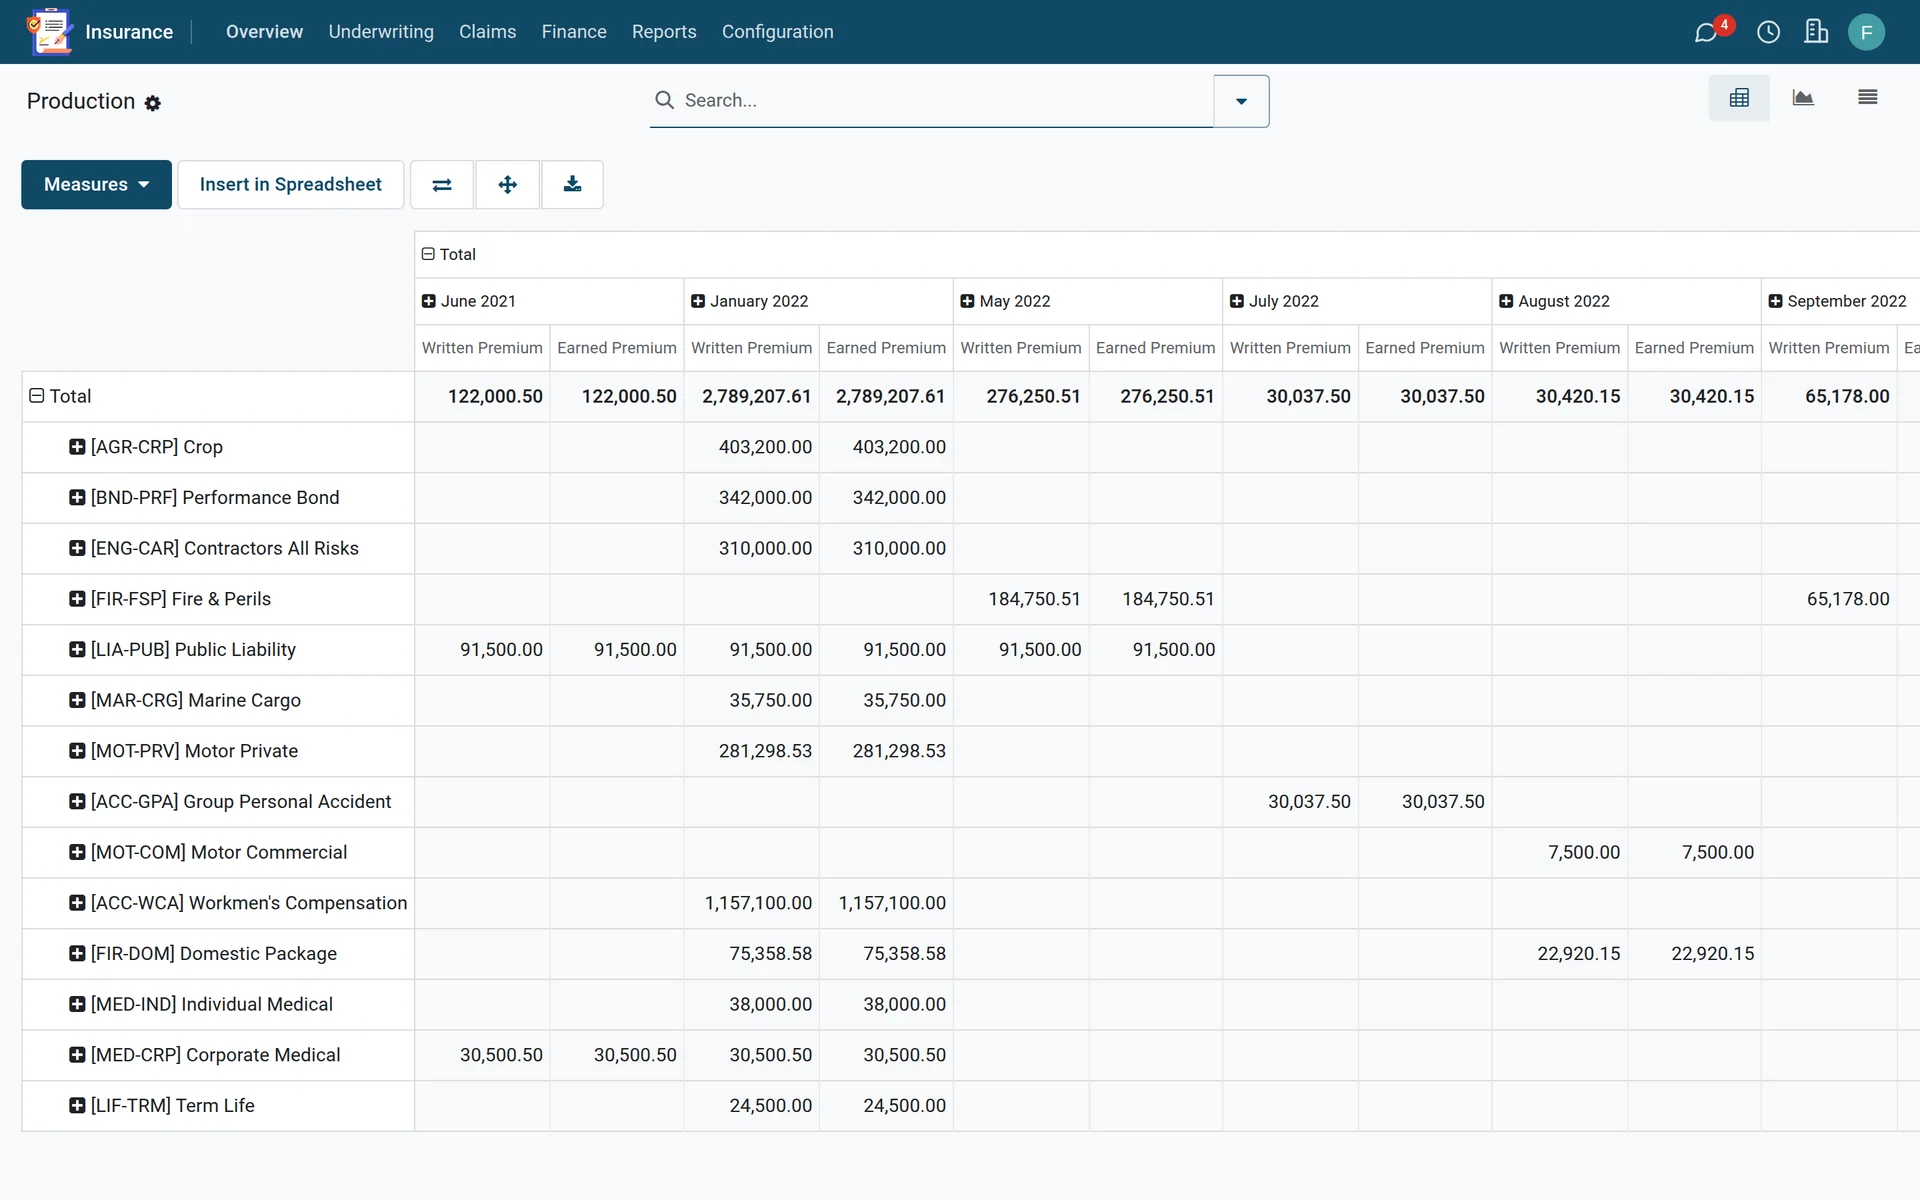
Written against earned, class by class and month by month. Every cell drills down to the premium lines it was summed from.
Written premium by month
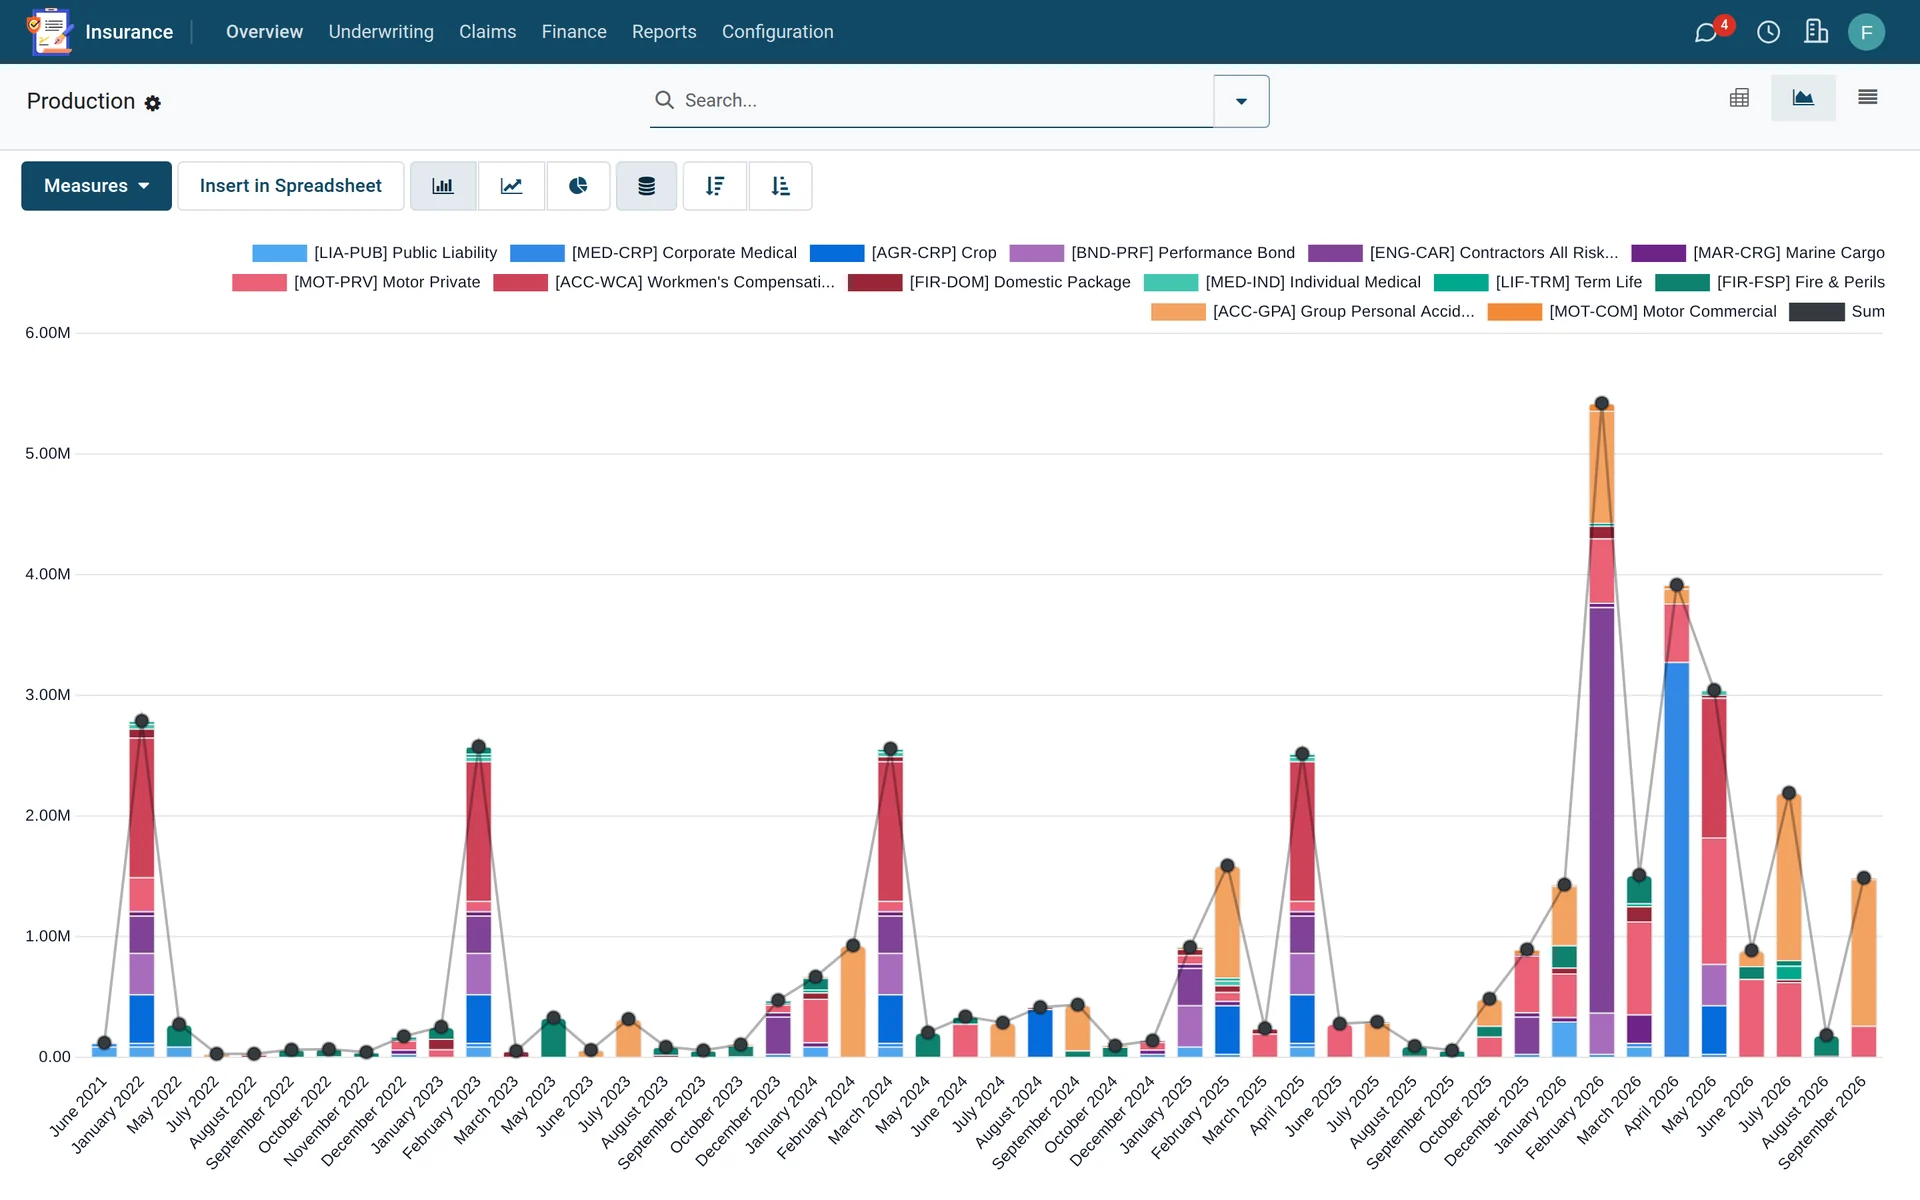
The same production as a stacked chart — the slide that goes to the board, drawn over the ledger rather than over a spreadsheet.
The premium register — 593 rows
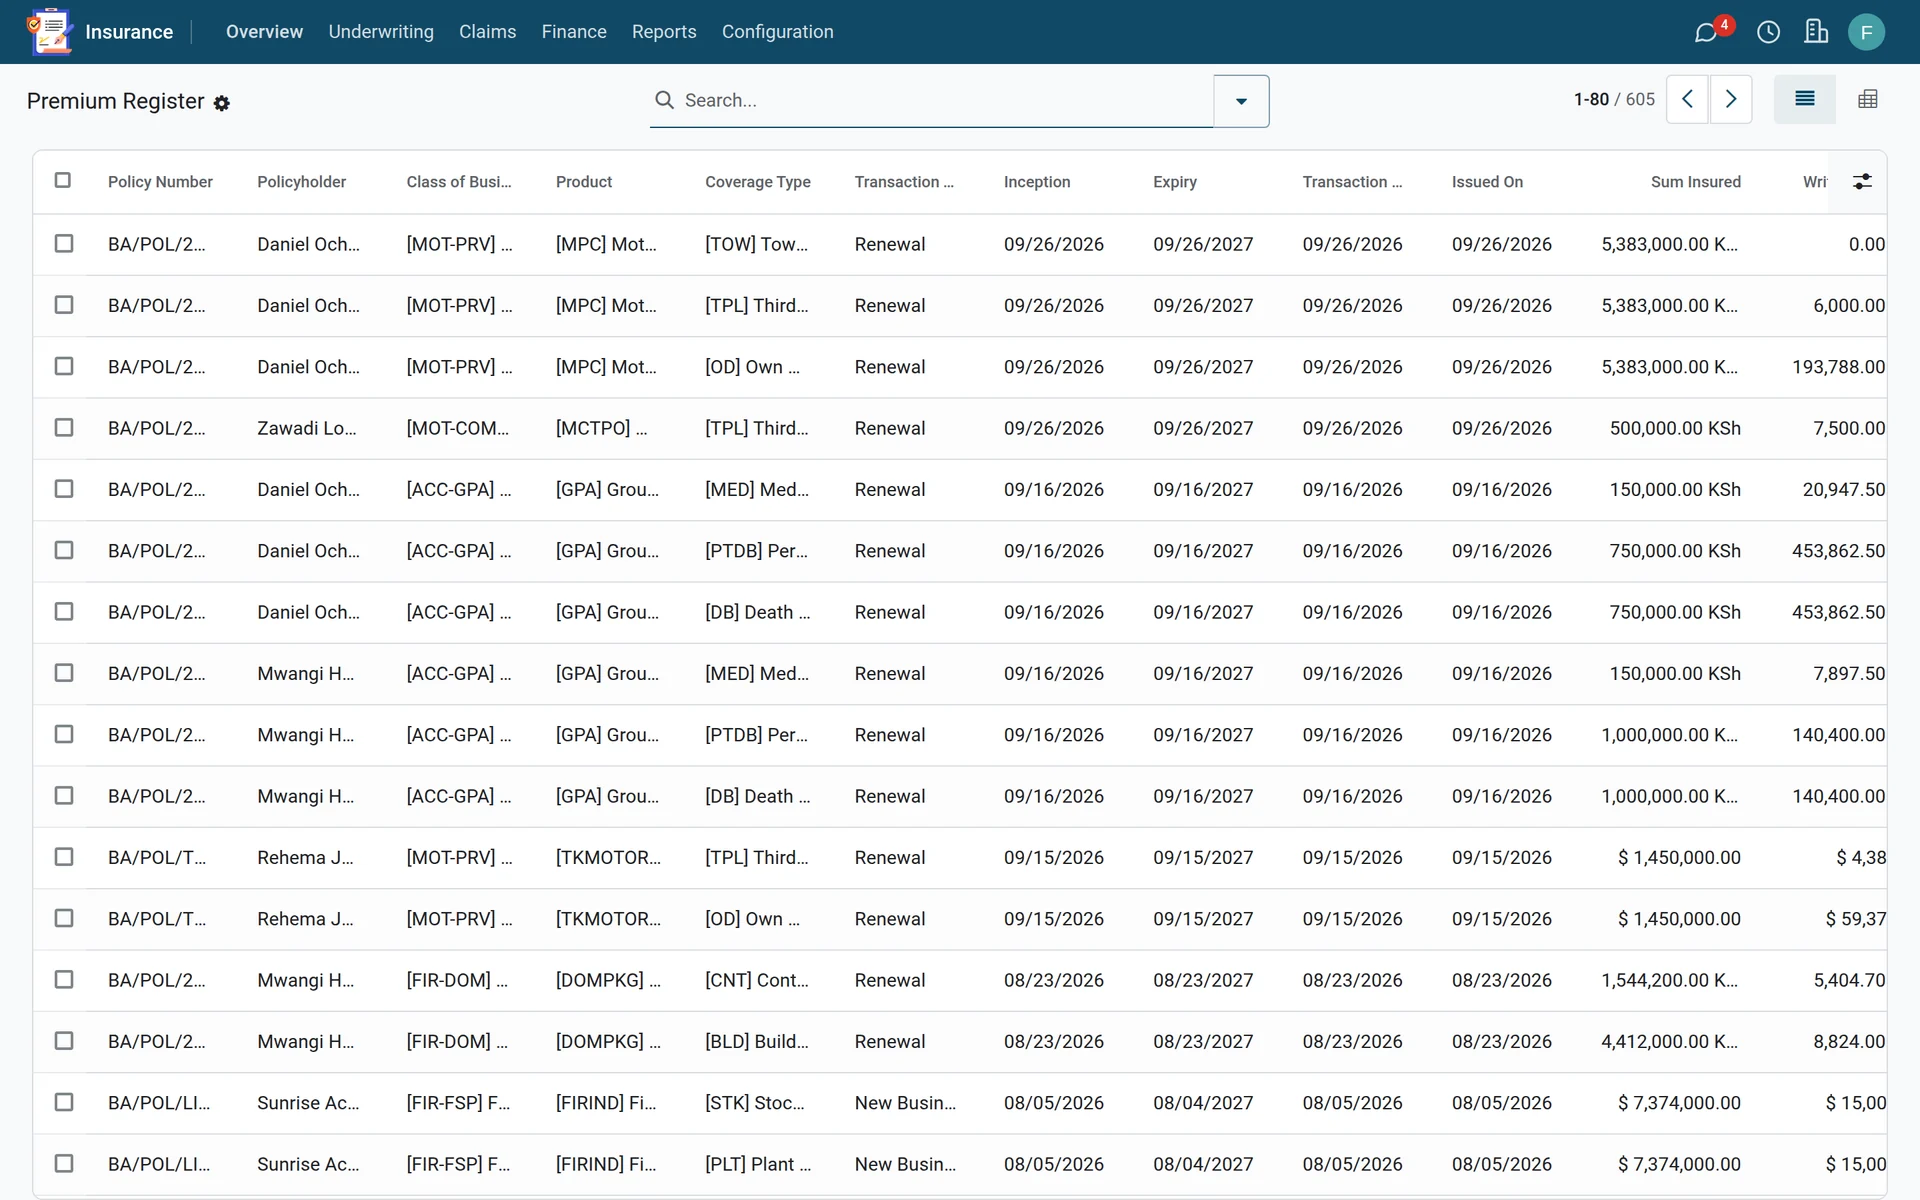
The source a production return is built from: policy, class, intermediary, period and premium on every line.